Creates a publication-ready paired (within-subject) plot for pre–post designs. Individual participant trajectories are shown as connected lines with optional mean overlay. Designed for thermometer-style scales or other continuous outcomes.
Usage
plot_prepost(
  data,
  pre,
  post,
  group = NULL,
  colors = NULL,
  pre_label = "Pre",
  post_label = "Post",
  y_label = NULL,
  title = NULL,
  point_size = 2,
  line_alpha = 0.35,
  point_alpha = 0.5,
  jitter = 0,
  show_mean = FALSE
)
Arguments
- data
A data frame in wide format containing the pre and post variables.
- pre
Unquoted name of the pre-intervention variable.
- post
Unquoted name of the post-intervention variable.
- group
Optional character string specifying a grouping variable. When provided, individual trajectories and (if requested) mean lines are colored by group.
- colors
Optional named character vector of colors for the
groupvariable. Names must match group levels.- pre_label
Character. Label displayed for the pre condition.
- post_label
Character. Label displayed for the post condition.
- y_label
Character. Label for the y-axis. Defaults to NULL.
- title
Character. Optional plot title.
- point_size
Numeric. Size of individual points. Default is 2.
- line_alpha
Numeric between 0 and 1. Transparency of paired lines.
- point_alpha
Numeric between 0 and 1. Transparency level for individual points. Lower values are recommended for large samples to reduce overplotting.
- jitter
Numeric. Horizontal jitter width applied to individual points (no vertical jitter). Useful for large samples to improve visibility of overlap.
- show_mean
Logical. If TRUE, overlays the mean trajectory.
Details
The function reshapes wide data internally using tidy evaluation. It is intended for within-subject comparisons (e.g., pre–post RCT outcomes). No axis limits are imposed; scaling adapts to the data range.
Examples
if (requireNamespace("dplyr", quietly = TRUE) &&
requireNamespace("tidyr", quietly = TRUE) &&
requireNamespace("ggplot2", quietly = TRUE)) {
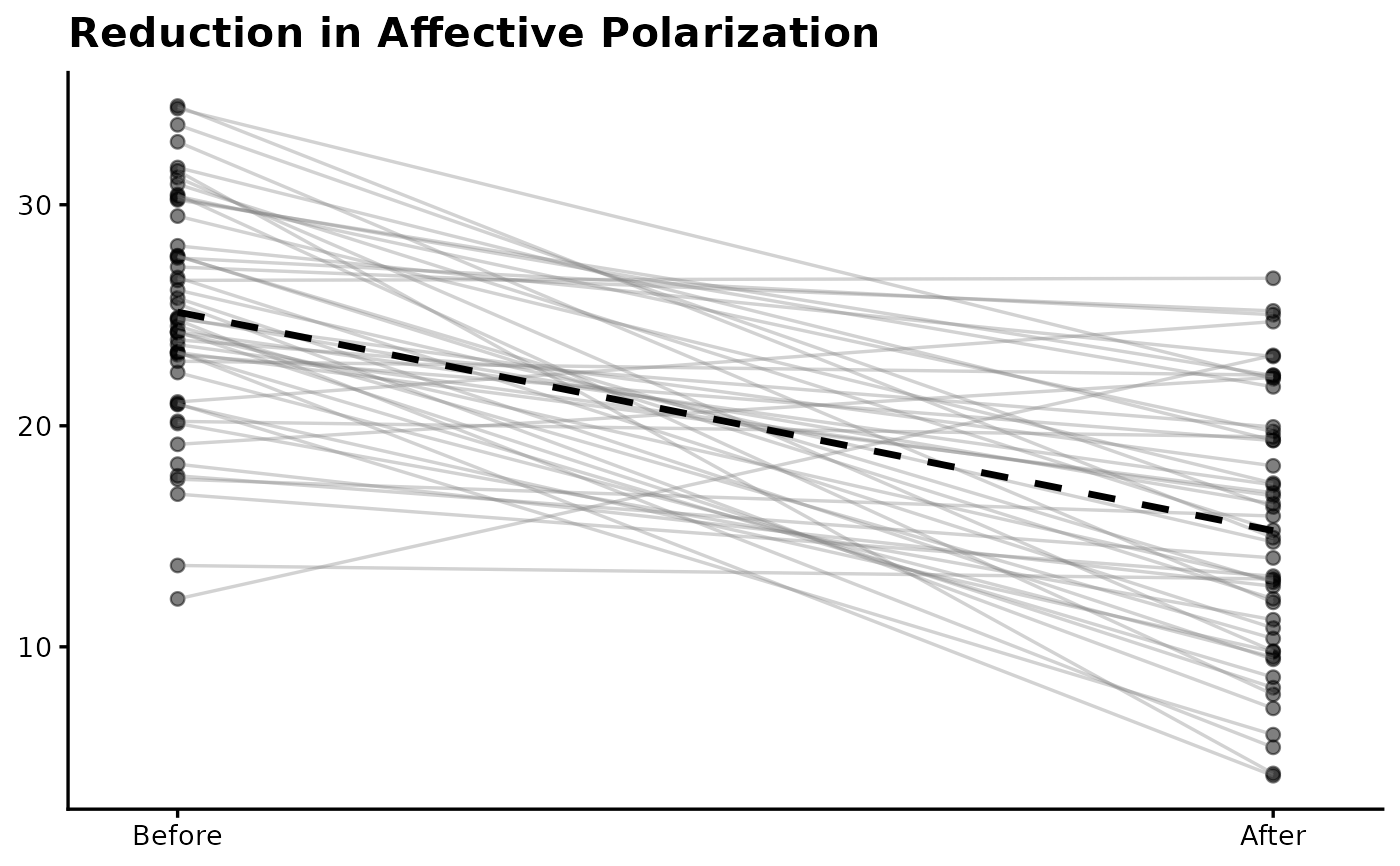
df <- data.frame(
pre = rnorm(50, 25, 5),
post = rnorm(50, 15, 5)
)
plot_prepost(
df,
"pre",
"post",
pre_label = "Before",
post_label = "After",
title = "Reduction in Affective Polarization",
show_mean = TRUE
)
}